In-Class Spreadsheet Lab
The CS Candy Store
Stage I
The first stage of this lab is to create a spreadsheet that looks like this:
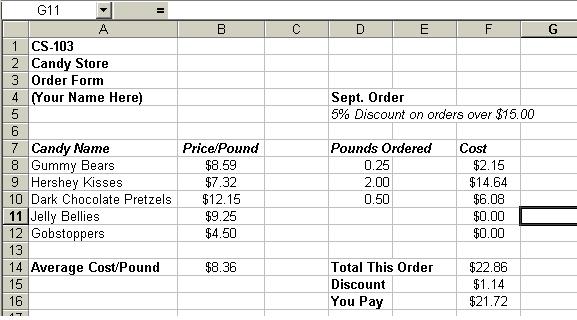
Follow these steps:
- Open a new spreadsheet and save it as candy (Excel will give it a .xls extension).
- Type the title of the spreadsheet as it appears in cells A1 through A3.
- Type your name in cell A4 of the sheet.
- Type all of the alphabetic information as it appears in the above sample.
- After typing all of the alphabetic information, adjust the column widths to compare with the above sample.
- Format each of the cells for bold, italics, or both as necessary to make your spreadsheet look
like the above sample. At this point do another save to make sure that you do not lose your work.
- Type the Price/Pound data in column B as shown. Format the numbers in this column to appear as in the sample.
- Type the data in the Pounds Ordered column as shown. Center this data.
- We are now ready to enter formulas. In cell F8 type the formula, = B8*D8,
which is the cost of the order for the Gummy Bears.
- Copy (Edit -> Fill -> Down) this cell into the remainder of the cells in column F, rows 9 - 12.
- Write and enter a formula for the average cost in cell B14 of your sheet. Your instructor will help you with this.
- Write and enter a formula for the total cost of the order in your cell F14. Save the spreadsheet.
- After your instructor has discussed the IF statement with you, use it to determine if the order
deserves the 5% discount and to calculate the amount of the discount. Place this formula in cell F15.
- Write a formula for the amount that you will pay in cell F16 and save the resulting spreadsheet.
Stage II
The second stage of this lab is to expand the spreadsheet that that you have created:
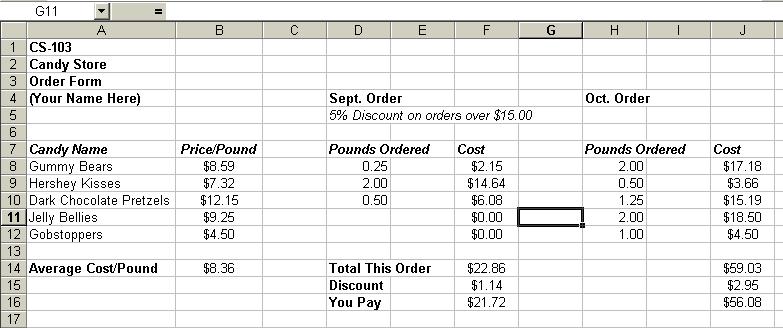
- Load your existing spreadsheet Lab51.xls.
- Type the alphabetic information in columns H - J.
- Type in the amounts of each kind of candy ordered in column H.
- Enter the appropriate formulas into column J. Save the result.
Stage III
In the third stage of this lab you will add some visual information to your spreadsheet in the form of bar charts.
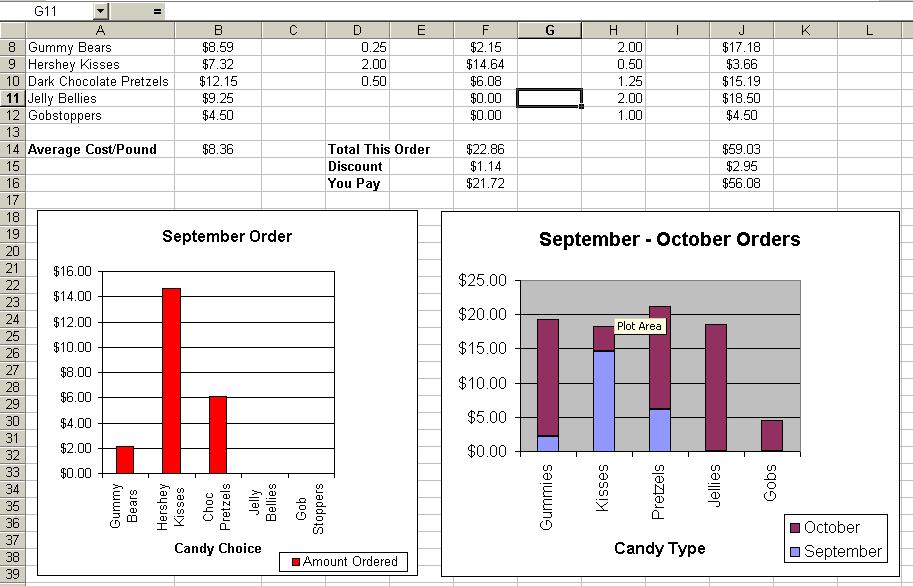
The information on constructing a simple bar chart (such as the September Orders Chart)
and a stacked bar chart (such as the combined September and October orders) will be given to
you by your instructor. After that you can create the two charts needed to complete this lab.