 |
Pig Visualizations( home | game | solution | links ) |
| Thumbnail | Description | Media |
|---|---|---|

|
A cross section of the optimal policy when the opponent's score is 30. The optimal boundary is the black line. The player should roll again at any turn total below that boundary and hold for any total above. The gray areas show the scores and turn totals that are actually reachable by the optimal player. |
Image Large Image |

|
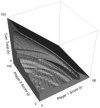
The entire roll/hold boundary for the optimal Pig play policy. |
Image Large Image Animation VRML |

|
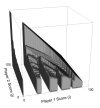
A view of all of the states reachable by an optimal player. Notice that an optimal player (shown as player 1) will never hold with a value between 0 and 21. |
Image Large Image Animation VRML |

|
Reachable states where rolling is optimal. |
Image Large Image Animation VRML |

|
Probability contours in Pig space. The contours show where the probability of player 1 winning is 3%, 9%, 27% and 81%. |
Image Large Image Animation VRML |
Author: Clif Presser