CS 391 Visualization Final Exam
due: Saturday 5/15 before
Submit your files by email. This document and required files can be found at http://cs.gettysburg.edu/~cpresser/cs391/final. You may use your book, your notes, class resources and the web. You may not discuss this exam with each other.
1) (20 points) In the final folder on the web you will find two images: fountain.png and encode.png. The latter contains a hidden message. Use vtk to find the message. The encoding procedure is done in two steps. First, create an image that contains the text of the message. Next, add that image pixel by pixel to the original image to get the encoded image.
You can get the original message by subtracting the original image from the encoded image. You will have to employ some of the processing techniques we used in class to enhance the message image. Your program should simply display the message image when processing is complete.
Turn in your program as question1.tcl.
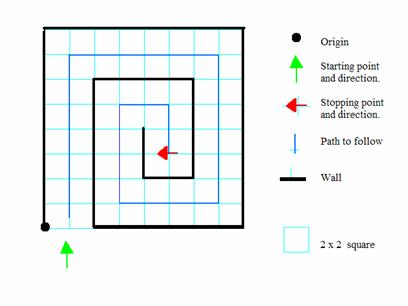
2) (20 points) Create a VRML fly-through of a scene defined in maze.wrl. The map is given in the file maze.png. Your fly-through should follow the blue line on the map from the starting point to the ending point. The fly through should start when the user clicks the green box and stop either when the camera is at the end of the path or when the red box is clicked.
- following the correct path 12 points.
- controls work correctly 2 points
- keeping the camera facing in the direction of its motion 4 points.
- moving the controls along with the camera. 2 points.
Turn in your program as question2.wrl.
3) (20 points) Construct a vtk visualization of the data file data.vts. The file is a structured grid dataset that contains scalar and vector attributes. The file is in the XML format, so you will need to use the vtkXMLStructuredGridReader class. You can see the geometry with a vtkStructuredGridGeometryFilter (a similar filter is used in your book on a rectilinear grid). Note: to get the nice grid view you have to filter out a single "slice" using SetExtent.
Turn in your program as question3.tcl.
4) (40 points) Pick some aspect of one of the topics below and create a visualization. You may use VRML, vtk or POVRay.
a) Theory
of Relativity. b)
The
c) Magnetic fields. d) The brain.
e) Platonic solids. f) Chemical reactions.
g) Theory of computation h) U.S. Census Data
These could be very time consuming if you let them become so. This problem is worth 40 points. Ten of those points are based on how understandable your visualization is. The other 30 are some combination of the following:
- Different objects/actors (multiple versions of the same thing count as one) 2 points each.
- Filter/transformation/group 2 points each.
- Labels: (points deducted for over-labeling) 1 point each.
- Interactions/animations (limit of 2 will be counted) 4 points each.
- Light sources other than headlights and directional lights 3 points each.
- Texture 3 points each.
- Camera angles (viewpoints) 2 points each.
Take your time and plan out your visualization, so you aren't just adding components as an afterthought. You may turn in more than one file for this e.g. two images containing different angles in POVRay, or data files along with your vtk program.
Your main file should be called question4.??? with the ??? replaced by the appropriate extensions.