Homework #8
|
CS 107 - Introduction to Scientific Computation Homework #8 |
1. Dice Frequencies: Given two sets of independent random event values and associated frequencies, compute the combined values and frequencies.
If a second set of values and frequencies is not supplied, use the first set in
their place, i.e. combine the set with itself. The returned values should be
sorted in increasing order. The returned frequencies should correspond to the
returned values, i.e. values(i) should occur with frequency freqs(i). (Hint
1: Form a nested loop through
both lists of events, summing values and multiplying frequency counts. Use
nargin to check the number of given arguments. Hint 2: One
can use the Matlab function "sortrows" to sort the output. Build the
values and freqs as is easiest, and before returning, create a matrix with
values and freqs as the first and second column, respectively. Then use
sortrows on the first column, and extract the new values and freqs (remembering
to transpose them back to row vectors).)
% diceFreq - given two sets of independent random event values and
% associated frequencies, compute the combined values and frequencies
% function [values, freqs] = diceFreq(values1, freqs1, values2, freqs2)
function [values, freqs] = diceFreq(values1, freqs1, values2, freqs2)
...
Example transcript:
>> [v, f] = diceFreq(1:6, ones(6))
v =
     2     3     4     5     6     7     8     9    10    11    12
f =
     1     2     3     4     5     6     5     4     3     2     1
>> [v, f] = diceFreq([1 2 4], [3 2 1])
v =
     2     3     4     5     6     8
f =
     9    12     4     6     4     1
>> [v, f] = diceFreq(1:6, ones(6), 6:-1:1, ones(6))
v =
     2     3     4     5     6     7     8     9    10    11    12
f =
     1     2     3     4     5     6     5     4     3     2     1
>> [v, f] = diceFreq(1:6, ones(6), v, f)
v =
  Columns 1 through 12
     3     4     5     6     7     8     9    10    11    12    13    14
  Columns 13 through 16
    15    16    17    18
f =
  Columns 1 through 12
     1     3     6    10    15    21    25    27    27    25    21    15
  Columns 13 through 16
    10     6     3     1
>> [v, f] = diceFreq(1:6, ones(6), v, f);
>> [v, f] = diceFreq(1:6, ones(6), v, f);
>> [v, f] = diceFreq(1:6, ones(6), v, f);
>> [v, f] = diceFreq(1:6, ones(6), v, f)
v =
  Columns 1 through 12
     7     8     9    10    11    12    13    14    15    16    17    18
  Columns 13 through 24
    19    20    21    22    23    24    25    26    27    28    29    30
  Columns 25 through 36
    31    32    33    34    35    36    37    38    39    40    41    42
f =
  Columns 1 through 6
           1           7          28          84         210         462
  Columns 7 through 12
         917        1667        2807        4417        6538        9142
  Columns 13 through 18
       12117       15267       18327       20993       22967       24017
  Columns 19 through 24
       24017       22967       20993       18327       15267       12117
  Columns 25 through 30
        9142        6538        4417        2807        1667         917
  Columns 31 through 36
         462         210          84          28           7           1
2. Dice Sum Simulation: To uniformly generate a random integer
from 1 to n, use randi(n). Create a function twoDiceSums that takes a
number of trials as input, simulates the roll of a pair of fair 6-sided dice,
and counts the number of times each possible sum is rolled. Return both a sorted vector
of 2-dice sum values and a second vector of their respective frequencies.
You can test your code by comparing the fraction of sum occurrences versus exact value from the prior exercise. Here are commands that normalize frequencies to probabilities, and plot them for comparison:
[v, f] = diceFreq(1:6, ones(6));
[v2, f2] = twoDiceSums(10000);
f = f / sum(f);
f2 = f2 / sum(f2);
plot(v, f);
hold on;
plot(v2, f2, '-.');
hold off;
A larger number of trials will make a closer approximation to the event probabilities.
Hint: To normalize frequencies, divide each frequency by the sum of all frequencies. Then you will have probabilities that sum to 1.
Example transcript:
>> RandStream.setGlobalStream(RandStream('mcg16807','Seed',0))3. Random Walk: To generate a value from a normal distribution with a mean of
0 and standard deviation of 1, use randn(). (To get mean m and standard
deviation s, use m + s * randn().) Create a function randomWalk that takes
a number of steps and returns a vector of the length (steps + 1) with initial value
0, and each
successive value being the previous value plus randn().
You can see the results of your random walks as follows:
steps = 100;
x = randomWalk(steps);
t = 1:length(x);
plot(t, x);
Example transcript:
>> RandStream.setGlobalStream(RandStream('mcg16807','Seed',0))
>> x = randomWalk(5)

x =

0 1.1650 1.7918 1.8669 2.2185 1.5220
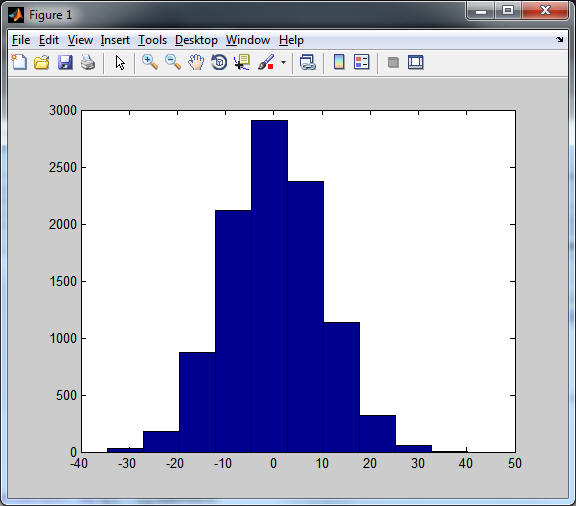
4. Monte Carlo Random Walk: Create a function MCRandomWalk that
takes two parameters: steps s and number of trials t. For each trial,
it uses randomWalk(s) to generate a random walk of the given number of steps, and it
stores only the last number returned. Having collected a final value from
each of t trials, these values are sorted (using sort) and we do the following:
res with hist(res),Example transcript:
>> RandStream.setGlobalStream(RandStream('mcg16807','Seed',0))
>> [ minimum, maximum, med, avg, stddev ] = MCRandomWalk(100, 10000)
Minimum: -34.4536
Maximum 40.1982
Median: 0.0133769
Mean: 0.0972835
Standard Deviation: 9.9065
90% confidence interval: [-15.9239 16.4839]

minimum =

-34.4536


maximum =

40.1982


med =

0.0134


avg =

0.0973


stddev =

9.9065

>>
Note: In older versions of Matlab, there are different means of setting random seeds. For example, you may need to use "setDefaultStream" rather than "setGlobalStream".