Slide 10 of 19
Notes:
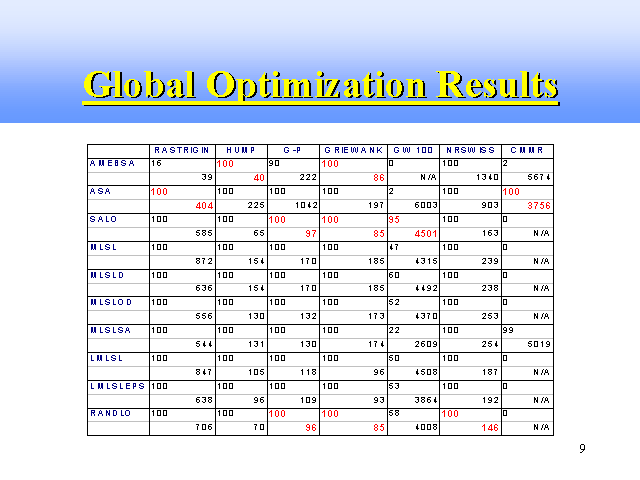
Each of these table entries represents the results of 100 optimization trials. The upper left corner indicates how many of the 100 trials successfully found the global minimum within .001. The lower right corner indicates the average number of function evaluations for each successful trial.


